|
17 February 2014
Posted in
Special research
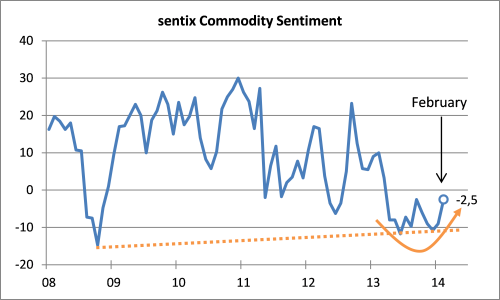
sentix Commodity Sentiment rises in February for the second month in a row and thus gives hope that the asset class will finally manage to gain back momentum. The recovery which can be observed in the index is also a positive sign for the emerging-markets economies whose dynamics are currently in doubt.
sentix Commodity Sentiment climbs from -9 to -2.5 points this month. That said, the indicator has now started a second attempt on his road to recovery. In June 2013, sentix Commodity Sentiment had marked its lowest reading since the end of 2008 when the investment bank Lehman Brothers had collapsed (see graph).
Against the backdrop of the current sorrows surrounding the economic dynamics of the emerging markets this development is a surprisingly positive one. Because rising commodities sentiment usually points to positive momentum in global economic growth. This, in turn, should – at least partly – come from rising demand in the emerging markets themselves. At the same time, this development should be beneficial to those emerging economies which export commodities.
Finally, the bottom-building process in the sentix Commodities Sentiment chart is complemented by current positive prices movements in broader commodities indices or single metals like silver or copper. So, from this side, too, shines a glimmer of hope in February.

Background:
sentix Commodity Sentiment is surveyed on a monthly basis since February 2004 and part of the sentix Asset Class Sentiment survey which is regularly conducted around the second Friday of each month. Further indicators of the sentix Asset Class Sentiment family of indices are sentix Bitcoins Sentiment, sentix Credit Sentiment, sentix Emerging Markets Bonds Sentiment, sentix Emerging Markets Equities Sentiment, sentix IPO Sentiment, and sentix Real Estate Sentiment.
Participants in the sentix surveys on asset class sentiment may choose a category from a range of 1 to 5 to show how inclined they are towards an asset class in relation to the others. The indicator may fluctuate between -100 and +100 while the third category (category number 3) of the given range marks the zero line and signals neutrality.
The current survey was conducted from February 13 to February 15, 2014. 940 investors (of which 250 institutional ones) took part in it.
