How to use the indicator
Since the sentix Time Differential Index is a measure of how strongly investors' emotions are opposed to their basic convictions (ratio) at a given point in time, it is suitable for timing the entry into or exit from the respective market. When emotions dominate the ratio and investors act differently in the short term than would be logical according to their longer-term value perception, this is an ideal opportunity for contrarian investors.
 An example: Investors have an above-average Strategic Bias for equities, i.e. they are convinced that prices will rise in the medium term. However, due to the current news situation and recent price movements, there are fears that are reflected in weak sentiment. Ideally, investors across the board then reduce their equity holdings in the short term, although their value perception of the asset class remains positive. In such a situation, the sentix Time Differential Index takes on distinctly low values (low sentiment minus high strategic bias) and thus signals a buying opportunity.
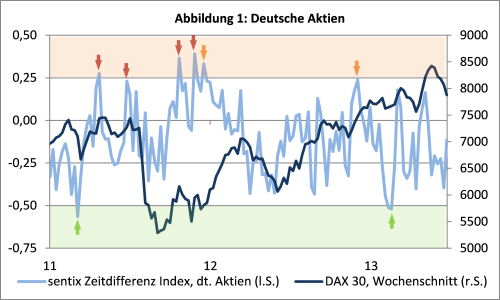
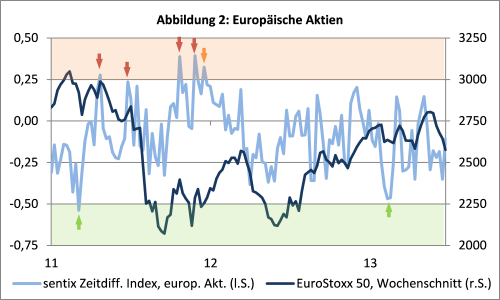
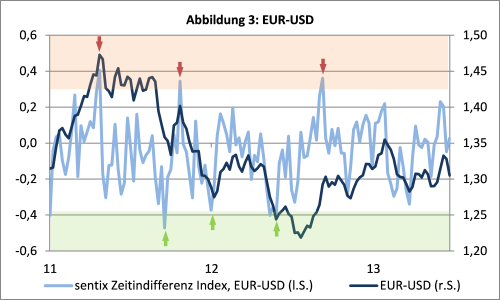
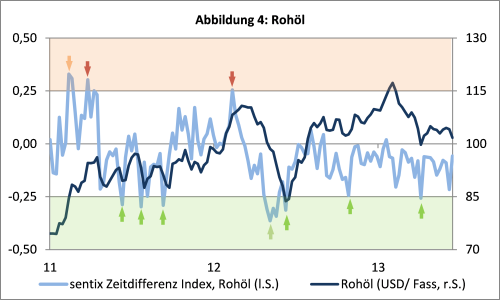
For the concrete use of the indicator, this means: If the time difference index reaches extraordinarily high values, this is a signal for an imminent weakness of the financial market under consideration. Conversely, if the time difference index is extremely low, this usually represents a good opportunity to enter the market. The threshold values at which the index strikes differ from market to market. For German shares, for example, a time difference index close to or above 0.25 has given good sell signals in recent years, while an index value below -0.50 has given buy signals. For the currency pair EUR-USD, on the other hand, the threshold values were +0.30 and -0.4 respectively (see the application examples). As a rule of thumb, if the values are around 1.5 standard deviations away from the respective mean in absolute terms, the probability is high that the time difference index will provide a usable signal.
A fruitful supplement to the Time Differential Index is the sentix Overconfidence Index. This indicates how one-sided a market has been in one direction in the recent past. It is thus a measure of how strongly investors perceive a market as "one-sided". With the perceived one-sidedness, the overestimation of one's own forecasting abilities (the "overconfidence") on the part of investors also increases. Therefore, the overconfidence index - like the time difference index - should be interpreted in a contrary way: If, for example, both indicators show particularly high values, this is a sign that the market under consideration will tend towards weakness in the near future. Because measured against their own basic convictions, investors in such a situation are too euphoric in the short term; short-sightedness dominates their actions. If the euphoria subsequently dissipates, investors' actions will again be more strongly determined by their longer-term fundamental convictions.
The data series of the sentix Styles Index and the sentix Risk Aversion Index can also provide important additional information when evaluating the Time Differential Index. They provide information on the risk appetite of investors. If this is already unusually high, for example, it would be a signal for a possible carelessness that has spread among investors and that can also be the driver behind a high time difference index. In the above example of the extremely high time-difference index, a low risk aversion index would reinforce the finding of pronounced short-sightedness.
For equity and bond markets, the sentix Time Differential Index can also be combined with the sentix Investor Positioning. This shows how strongly investors are broadly invested in a market (measured against their benchmarks). In the example of a high time difference index chosen above, a high positioning also fits the picture of an investor community characterised by short-sightedness. It can then be understood as an indication that large parts of the investors have already translated their short-term high optimism (which is in contradiction to their longer-term conviction) into corresponding purchases of securities or that the very good short-term mood is possibly the result of wishful thinking about the positions taken. In both cases, the high positioning results in a price risk that will be felt at the latest when the momentary euphoria evaporates again and the basic convictions of the investors come more to the fore instead.
The concrete decision to invest in the stock market is also made easier by taking into account the sentix Sector Sentiment. This index enables investors to differentiate between the individual sectors of the stock market in terms of sentiment. For the bond markets, the sentix maturity preference index offers additional orientation.
For intermarket observations, the time difference indices for the individual financial markets should ideally first be converted into Z-scores so that they can then be better compared with each other.


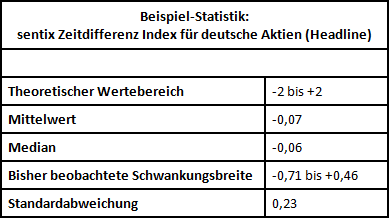 sentix Time Differential Index, Descriptive Statistics - Source: own calculations
Customer Feedback (0)