")
")
sentix Sector sentiment (Euro area equities)
The sentix Sector Sentiment is methodologically a combination of "Sentiment" and "Strategic Bias". This is because, unlike the weekly sentix survey on the financial markets, the question asked of investors to determine the sector sentiment is not divided into two periods. Only the 6-month expectation of investors is asked here, but not their 1-month expectation, as is the case in the weekly financial markets survey. This means that information from both time periods is included in the survey results. Therefore, the sector sentiment carries characteristics of both the classic sentix Sentiment (1-month expectation), which is used as a contrarian indicator, and the sentix Strategic Bias (6-month expectation), which is typically used as a directional indicator.
How to use the indicator
sentix Sector Sentiment: a relative measure. Why?
The sentix Sector Sentiment is constructed as a relative measure. In the sentix survey on the 19 Stoxx sectors, which takes place once a month (on the third Friday of each month), investors are asked how they assess the performance of a sector in relation to the overall market over the next six months (outperformance, market performance, underperformance). The question was chosen because stock markets are generally subject to longer-term upward trends, which would tend to lead to only slightly differentiated answers from the investors participating in the survey if the assessment were detached from the market as a whole.In a second step, the individual sector scores obtained at a given point in time are normalised across the sectors (see below for the exact construction) and calculated as Z-scores. This is done to give the user a clear, comparable assessment of this sentiment measure. Among other things, this also compensates for possible biases in the answers (towards the negative or positive), because Z-scores are centred around the value zero.
According to the construction of the sentix Sector Sentiment as a relative measure, the indicator is primarily suitable as a signal generator for the overweighting, underweighting or neutral weighting of a sector. When implementing such a relative signal, it is obvious to set the selected sector against the corresponding market - e.g. to buy an automobile index while simultaneously selling the overall market index (provided there is an overweight signal for the automobile sector).
Absolute buy or sell decisions for sector indices or futures can also be made using indicators from the sector sentiment. In this case, however, other indicators, e.g. the sentix strategic bias for European equities or the sentix economic index for Euroland, should be used to clarify which development is to be expected for the overall market. If, for example, the expectation of rising (falling) stock markets arises, then a sector for which an outperformance (underperformance) is to be expected according to sector sentiment can also be bought (sold) without it being counter-financed by the sale (purchase) of the overall market index.
Use as a contrarian sentiment indicator
Classic sentiment indicators are used as contrarian indicators. They send the best signals when they have reached extreme values: At highs, they indicate that a sell should take place in the market under consideration (because then most investors are already committed to the market, often also due to euphoria contrary to their rational conviction).Conversely, at lows these indicators give a buy signal (because then hardly any investors are still invested, often also due to fear or panic contrary to their actual basic conviction). The signals are usually clearer at lows, which is partly due to the fact that stock markets tend to rise and partly due to the fact that when panic arises, investors' reactions, i.e. their portfolio adjustments, are more violent than in situations where euphoria arises.
The sentix Sector Sentiment for the 19 Stoxx sectors - like a classic sentiment indicator - usually oscillates between a maximum and a minimum and signals opportunities to enter or exit a sector at these extreme values. However, the sentix sector sentiment indices are constructed as Z-scores. This means that the historical highs and lows of the sentiment values of the individual sectors can shift over time. It can also be observed that the ranges within which the past sector sentiment values of the different sectors move differ from each other: The chart below (from January 2014) shows that the sector sentiment for banks, for example, fluctuates roughly between -2.5 and +2 standard deviations, whereas the media sentiment only fluctuates within a range of -2 to 0.

Figure 1: Ranges of the previous sentix Sector Sentiment values for the 19 Stoxx sectors and current values from January 2014
Therefore, the following should be taken into account when interpreting the sentix Sector Sentiment as a contra indicator:
- Basically, values of around -2 or smaller and of around +2 or larger in themselves send contrary signals
- If there are extreme values for an industry that do not come close to the extreme ranges mentioned in a), caution should be exercised with these. Here it may be that a structural confidence or denial existed or exists for years, but may eventually dissipate. If such a structural perception of investors dissipates, the extremes for the sector shift. In this situation, although they represent extremes in relation to the industry up to this point, they are not to be interpreted in a contrary way.
To take up the example of the bank sentiment from the chart above (Fig. 1) again: The sentix sector sentiment for banks is not only conspicuous for the particularly wide range within which it moves, it is also at an all-time high (at just under two standard deviations). This sends a sell signal. Why? The high sentiment indicates that the broad mass of investors is already convinced that bank stocks will outperform the overall market in the coming months. Many of the investors with these expectations will already be exposed to bank stocks. This makes it unlikely that additional buyers for these stocks will enter the market in the near future. Accordingly, the upward pressure on bank share prices will ease. At the same time, the share of invested investors who might be inclined to take profits increases, which could trigger downward pressure on prices. The combination of both (fewer additional buyers, more additional sellers) then argues for an end to the outperformance period.
The formation of sentiment divergences as an anti-cyclical signal
As with other sentiment indicators, so-called sentiment divergences can also occur with the sentix Sector Sentiment. These are characterised by a sequence of highs or lows of the sentiment index in the trend running in the opposite direction of the trend of the corresponding sequence of highs or lows of the associated sector index (or future). Sentiment divergences usually indicate that the associated market trend is about to reverse - because they indicate that the (maximum) strength of the bulls (in a sequence of highs) or the bears (in a sequence of lows) is diminishing over time.Figure 4 in the "Figures" section (not in the body text here) provides an example: Here, the sentix sector sentiment for food (blue line) shows a downward sequence of highs from late 2011 to mid-2013 (broken orange line). But in the same period, the relative performance of food stocks continues to rise in trend (grey line). This divergence in sentiment and relative performance of the sector index is the sentiment divergence. It indicates in Figure 4 that the relative performance of food stocks is on the verge of a trend reversal - and indeed this did take place from mid-2013 onwards!
Use as a directional indicator in the sense of strategic bias
In phases in which the sentix Sector Sentiment for an industry does not move in extreme ranges that signal a high probability of a trend reversal, the Sector Sentiment can be used as a directional indicator for the associated relative performance indices. This is because it usually has a lead time before the development of the relative performance that matches it (see, for example, Figures 4 and 5 in the "Figures" section). However, in such phases it is difficult to determine how much "sentiment" (price-led sentiment) and how much "strategic bias" (rational fundamental conviction) is in the indicator in each case. In phases in which sector sentiment develops very similarly to relative performance, it is likely that the indicator mainly reflects sentiment driven by price developments and does not carry any additional information beyond this. In phases in which sentix Sector Sentiment behaves significantly differently from relative performance - i.e. either shows stronger changes or even moves in the opposite direction - the probability is high, on the other hand, that the indicator reflects a changing basic conviction of investors for the market under consideration (see e.g. Figure 5 in the "Figures" section, year 2012).
Identification of "investor darlings" and deniers
If sector sentiment moves in the opposite direction to relative performance, this may also indicate that the sector in question is an "investor darling" or that investors have adopted a holdout attitude towards the sector. Such phenomena occur, for example, when in the past the shares of a sector faced a particularly good or a particularly bad performance over a long period of time, which investors then perpetuate - because they have become carefree towards the sector, for example, and blank out information that speaks against their view of the sector (selective perception).Such "favourites" or "ignored outperformers" (= rejection attitudes) can be easily identified in a chart in which the outperformance of a sector (relative strength) is plotted on the x-axis and compared with the sentix sector sentiment on the y-axis. In the chart below, the relative strength on the x-axis is the relative performance of the respective sector as a 26-week performance compared to the overall market.
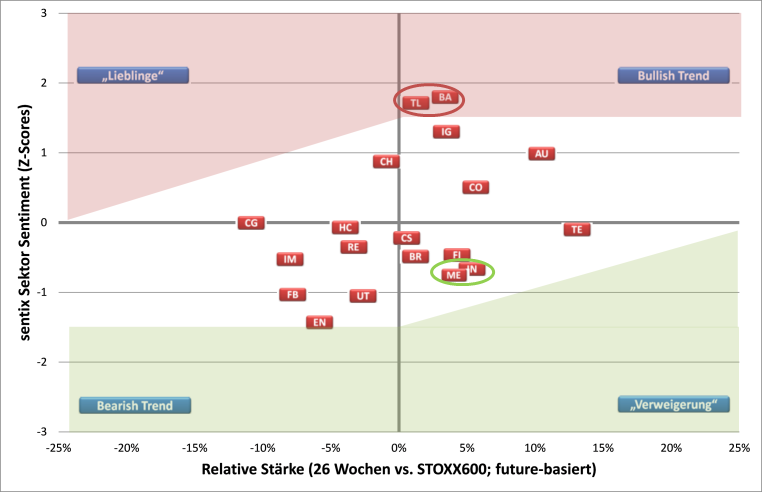
Figure 2: Diagram for the identification of "investor favourites" and "deniers"
On the other hand, those sectors are worth noting that are currently underperforming (left half of the chart) and yet are considered by investors to be more attractive than average (upper half of the chart). Sectors facing such a constellation are among the "darlings" of investors. Here, investors have - at least temporarily - become blind to the current weak performance out of enthusiasm (about past performance, about certain attributes or out of zeitgeist). But even in this case, sooner or later a process of realisation will set in among investors that will exert additional selling pressure on the securities of the respective sector - with correspondingly negative consequences for further (relative) performance.
In Figure 2, for example, media stocks ("ME") and insurance stocks ("IN") are among the stocks for which investors have adopted a refusal attitude (see bottom right). On the other hand, chemical stocks ("CH", top left) tend to be among the "investor favourites", as do technology and banking stocks - even if the latter still show a slight outperformance against the overall market on a 26-week basis.
Creation of sector pairs (taking simultaneous long and short positions)
If sectors are identified for which out- or underperformance is expected in the near future, so-called sector pairs can be formed, in which the taking of a position in one sector is financed by taking a reverse position in the other sector. In such a case, a long position is thus established for a sector for which there is an outperformance signal, and at the same time a short position is established for an equity sector for which underperformance is expected. Figures 7 and 8 (in the "Figures" section) show examples. Particularly impressive in Figure 7 is the low that formed in the relative sentiment of financial services and food in 2012, which was followed by a strong upward movement in mid-2012, which in turn led to an increase in relative performance.
Interaction with other sentix indicators
Often the constellations are not as clear in real time as they appear in retrospect on the chart. It can therefore be helpful or necessary to check the validity of an indication obtained from the sentix Sector Sentiment by consulting other indicators. At the same time, the sector sentiment can be an additional source of information for the interpretation of other sentix indices.
The following indicators from the sentix data universe can complement the sentix Sector Sentiment:
- If you want to identify whether cyclical or defensive sectors are likely to outperform in the near future, two sentix indices are particularly useful for the European stock markets: sentix Sentiment as a contrarian indicator and sentix Strategic Bias as a directional indicator. A very low sentiment (signalling fear or panic), for example, points to a rising overall market soon and thus to outperformance opportunities for cyclical sectors. The same applies to an increasing strategic bias (at ideally above-average levels), which reflects investors' fundamental beliefs. The opposite constellation - high sentiment, decreasing strategic bias at ideally low levels - indicates an opportunity for defensive sectors. Sentix Sentiment and sentix Strategic Bias are combined in the sentix Time Difference Index, which can be used as an alternative to the two individual indicators. Furthermore, the sentix Investor Positioning for European equities can be used as a contrarian indicator for market timing.
- If the aim is to identify the right phase of an economic cycle in order to derive additional conclusions for upcoming sector rotations, the sentix economic index for Euroland can be used as a supplement.
- The sentix Euro Break-up Index provides information on the status of the euro crisis: It can be a useful supplement to the sentix Sector Sentiment if the latter sends signals for sectors that are "euro crisis favourites" (such as pharmaceuticals or consumer goods) or that were particularly avoided during the crisis.
Conversely, the sentix Sector Sentiment can also be used to draw conclusions about the upcoming overall market performance:
- A high number of "favourites" or " deniers" can also become an overall market factor. For in this case, it is likely that a large number of cognitive dissonances are present. This means nothing other than that issues dominating the market are obviously not understood by investors. As soon as investors then disengage from their "favourites", this again reinforces the prevailing market movement and triggers an extensive sector rotation.


Specifications
- Code: SNTS
- No. Serien: 117
- Start: 2002-02-08
- Rhythm.: monthly
- Fristigkeit: mittelfristig (6 Monate), Erwartungen
- Investor: Institutionelle, Privatanleger, Headline Index

Customer Feedback (0)