sentix Styles Index
The sentix Styles indicator family is a compilation of indices that show which investment styles on the equity and bond markets are of particular interest to investors. For the equity market, they map the preferences with regard to different segments such as growth or substance stocks. The indices also provide information on investors' tendency to follow trends and their investment horizons. The latter investment styles are also surveyed for the bond market. What all indices of this indicator family have in common is that they provide information on investors' risk appetite and can therefore be used to construct indicators of risk appetite.
How to use the indicator
The indices of the sentix Styles indicator family are collected monthly together with the sentix Asset Class Sentiment. Both indicator groups, sentix Styles Index and sentix Asset Class Sentiment, have in common that they reflect the current preferences of investors regarding their investment behaviour. While these preferences for sentix Asset Class Sentiment refer to different asset classes - such as real estate, corporate bonds (credits) or even IPOs - the sub-indices of the "Styles" family refer to investment styles such as short- or long-term investment or also the preference of secondary over main stocks on the stock market.
The "Styles" indicators are suitable for identifying certain topics that are currently in the focus of investors and are then often accompanied accordingly by the media. They illustrate where investors' attention is focused at a given time and which topics and news they are particularly receptive to. They are an ideal complement to the other sentiment indicators because they provide a deeper insight into investors' current risk preferences. For example, investor behaviour at a certain point in time - even according to "classic" sentiment - may appear defensive overall. And yet investors may then present themselves very aggressively in some segments - e.g. growth stocks or emerging markets stocks - which can be identified with the sentix Styles indicators. Such a situation would in turn indicate increased risks, because there is a possibility that the pessimism measured is only a "purpose pessimism", but not actually a bearish underlying attitude.
Because the "styles" indices reflect investors' risk preferences, they can be used to calculate indices on risk appetite (see explanations below). This does not require any price information from the financial markets. The risk propensity indices are calculated solely from sentix data reflecting investor behaviour. This makes them unique.
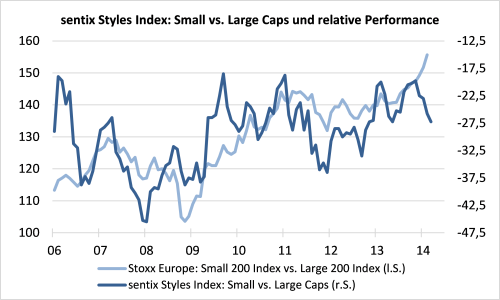
In comparison with the development of the associated markets, it often becomes apparent that the individual "styles" indicators have a lead time before the corresponding market indices (cf. e.g. Figure 5 for the index on major and minor stocks) and can consequently be used as directional indicators for forecasting purposes. From this observation it can be deduced that they belong to those indicators that are relatively strongly characterised by the "wisdom of the many" and thus convey basic convictions of investors - and less by views of market participants that are influenced by emotions and fluctuate strongly in the short term.
Indices related to the equity markets
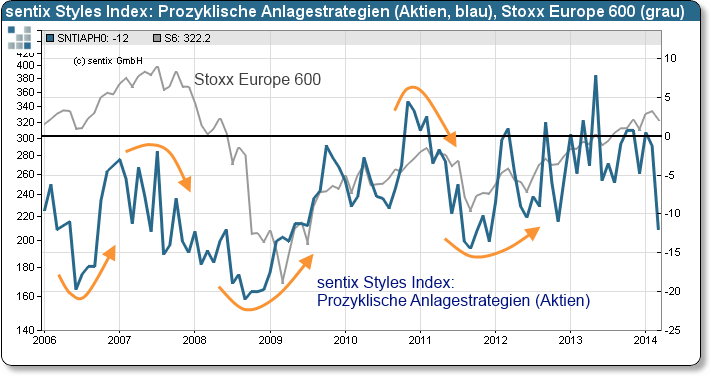
- sentix strategy type (equities): This index shows whether pro- or anti-cyclical investor behaviour currently dominates the equity market. A high degree of pro-cyclical behaviour (negative index values) indicates that investors are strongly oriented towards the given price development or the prevailing trend and trade the market only little out of their own conviction. Herd behaviour can often be observed in this case. Such a situation is significantly riskier - for the breadth of investors and the market development as a whole - than an environment in which investors consciously choose anti-cyclical courses of action out of their own conviction (see e.g. Figure 1).
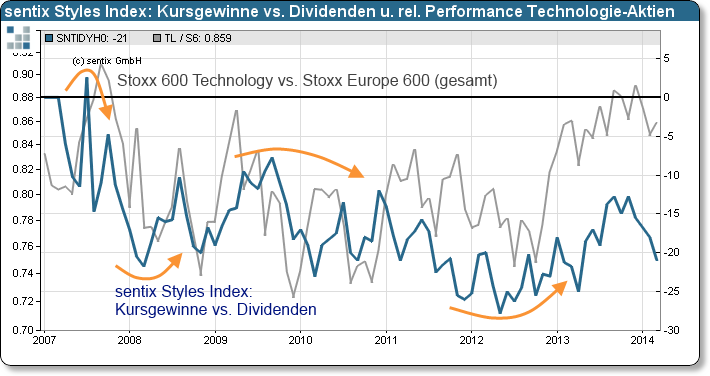
- sentix Price gains vs. dividends: The indicator looks at whether investors at the time of the survey would enter into a share commitment more out of the motive of dividend payments or due to speculation on price gains. The latter motivation is a sign of greater risk appetite, while the search for dividends is an indication of a more cautious approach on the part of investors. This index can therefore be used to determine whether, in a certain market phase, stocks with high dividends are more "in vogue" or those that are characterised more by price gains. The indicator can also be used to analyse dividend futures (see e.g. Figure 4).
- sentix Small Caps vs. Large Caps: The index represents the preference of investors for major ("large caps") or minor ("small caps") stocks. If "large caps" are preferred, this is a sign of low risk appetite. This is because large caps are particularly popular during periods of market stress, when investors seek safety (especially because they are highly liquid and also have relatively steady earnings trends due to their broad positioning). Risk appetite, on the other hand, is relatively pronounced when "small caps" are highly in favour with investors because their prices are subject to greater price fluctuations (among other things due to their lower liquidity and their more volatile profit development) (see e.g. Figure 5).
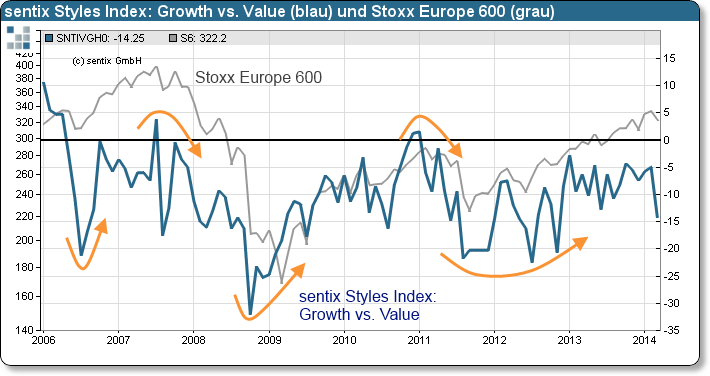
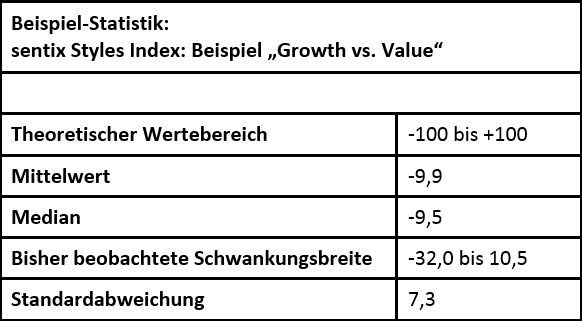
- sentix Growth vs. Value Stocks: This indicator shows whether investors are currently more inclined towards growth stocks or value stocks. Value stocks are particularly sought-after in phases when investors are primarily concerned with security. This is because their performance - similar to that of "large caps" - is less susceptible to fluctuations due to their relatively high liquidity and relatively steady earnings prospects. Growth stocks, on the other hand, are preferred - similar to "small caps" - when investors' appetite for risk is relatively high (see e.g. Figure 2).
- sentix short-term vs. long-term strategies (equities): The index shows which investment horizon investors prefer at a given point in time. Longer-term commitments on the stock market tend to be made for defensive motives, whereas short-term ones are often made for speculative reasons and thus indicate an offensive, relatively aggressive behaviour on the part of investors. In the latter case, investors consequently exhibit greater risk appetite than when they seek longer-term commitments.
Bond market related indices
- sentix strategy type (bonds): This index is to be understood analogously to the index for the stock market described above: A relatively high procyclicality in investment behaviour represents relatively risky behaviour. Anticyclicality, on the other hand, indicates risk aversion or more cautious actions (positive index values).
- sentix short-term vs. long-term strategies (bonds): This index is again analogous to the index for the stock market described above: It reflects the preferred investment horizon of market participants. Short-term strategies are also a sign of increased risk aversion, longer-term ones of risk appetite.
Index related to the emerging markets
- sentix Emerging Markets Asset Allocation Bias: The indicator shows investors' preference for emerging market equities over emerging market bonds: the higher the index, the higher the preference for emerging market equities (and the lower the preference for emerging market bonds). It is constructed as the difference between the sentix Emerging Markets Equity Sentiment and the sentix Emerging Markets Bonds Sentiment (see respectively sentix Asset Class Sentiment).
Risk appetite indicators constructed from the sub-indices
Since the individual styles indices - as described - provide information about the risk appetite of investors, they can be combined into risk appetite indices for shares, for bonds and for the financial markets as a whole. The various indices of the sentix Styles Index family are combined with selected indices from the sentix Asset Class Sentiment indicator group. In an extended form and converted into so-called Z-scores, these can also be found in the indicator family of the sentix Risk Aversion Index. The risk indices of the "Styles family" are available in absolute values.
- sentix Risk Propensity (Equities): This index is calculated as an average of all five "Styles Indices" listed above as well as two additional indices that belong to the sentix Asset Class Sentiment indicator family (sentix IPO Sentiment and sentix Emerging Markets Equity Sentiment). All sub-indices of the sentix risk sentiment (equities) are constructed in such a way that a higher value also indicates a higher willingness to take risks. For this reason, an average value can be formed here from the total of seven sub-indices without having to carry out transformations beforehand.
- sentix Risk Propensity (Bonds): This index is calculated as an average of the two "Styles Indices" listed above as well as two additional indices that belong to the sentix Asset Class Sentiment indicator family (sentix Credits Sentiment and sentix Emerging Markets Bond Sentiment). All sub-indices of the sentix risk sentiment (bonds) are constructed in such a way that a higher value also indicates a higher risk appetite. For this reason, an average value can be formed here from the total of four sub-indices without having to carry out transformations beforehand.
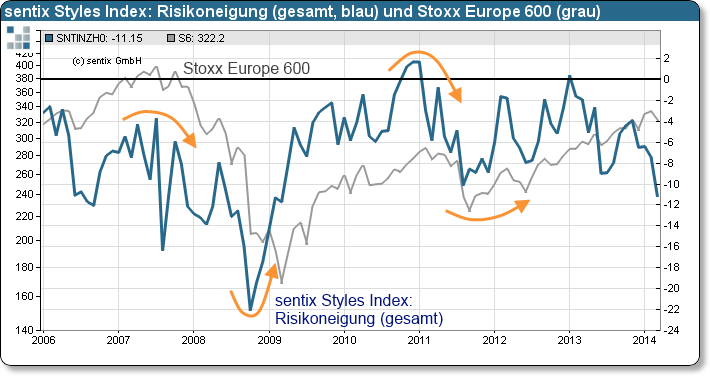
- sentix Risk Propensity (Overall index): This index is calculated from all indices that are included in the two risk propensity indices for the stock market and for the bond market plus the individual index "sentix Commodities Sentiment" from the sentix Asset Class Sentiment. In total, twelve indicators are included in the sentix risk propensity (total), the average value of which results in the current indicator value. The indicator is - as its name suggests - a measure of the risk propensity on the financial markets as a whole. Our analyses show that the sentix risk propensity (total) is an adequate measure of this risk propensity, which is also clearly superior to the individual sub-series of the index as a measure of risk. The aggregation of the twelve individual sentix indices into investor preferences thus creates real added value here and thus also underlines the quality of the sentix time series (see Figure 3).
Illustration and examples
Indicatoir construction
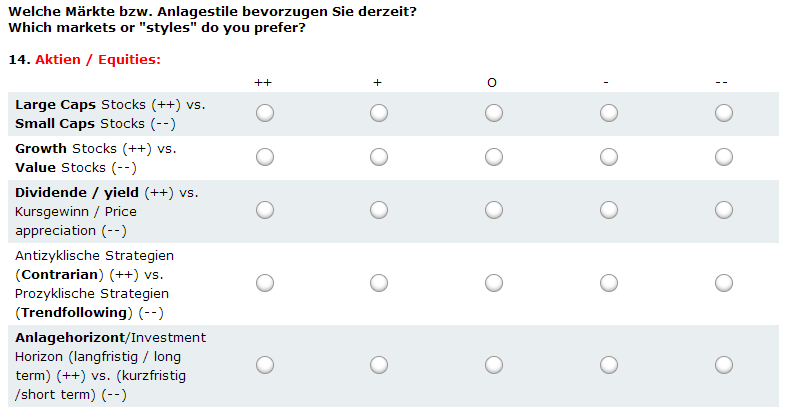
Questionaire
Note: The above figure is an excerpt from the sentix special survey on the sentix Styles Index, which is surveyed monthly together with the sentix Asset Class Sentiment. A total of five questions are asked about the different investment styles for equities and two questions about the investment styles for bonds. In most cases, the more defensive investment style is named first here. One exception is the pair "growth vs. value".
Calculation formula
Note: The various indicators of the sentix Styles Index family are each constructed in such a way that more offensive, riskier investor behaviour leads to a higher index value. In the question, however, the more offensive investment style is not always mentioned in second place, which is implied by the above formula and the construction goal of the indicators. Therefore, in the case where the more aggressive investment style comes first - i.e. for the "Growth vs. Value" index - the initially calculated survey value is still multiplied by (-1) to obtain the final indicator value.
Specifications
- Code: SNTI
- No. Serien: 39
- Start: 2005-02-01
- Rhythm.: monthly
- Fristigkeit: mittelfristig (6 Monate), Erwartungen
- Investor: Institutionelle, Privatanleger, Headline Index
- Land / Region: Global Aggregate
- Frei verfügbar: sentix Website, Bloomberg L.P.



Customer Feedback (0)