How to use the indicator
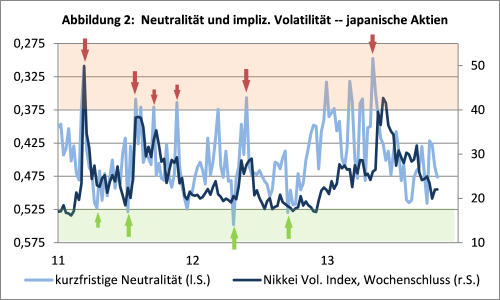
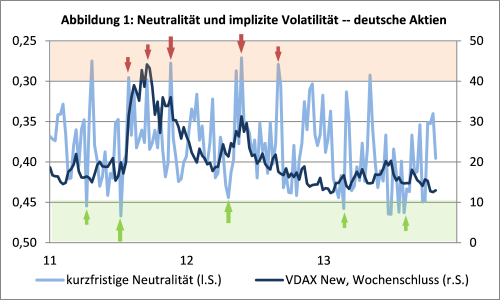 As a general rule, extreme values of the sentix Neutrality Indices in particular provide important information for market timing: a very high number of neutral investors often indicates acute investor irritation and rising volatility in the future. This is because the neutral camp is usually characterised by uninvested or only slightly invested investors who can become demanders or sellers when their irritation fades. When these investors reappear on the market, they bring movement into prices through their transactions and thus cause volatility to rise. Conversely, very low neutrality values signal that a phase of declining volatility is imminent, because there is then a high probability that the number of active market players will decrease in the near future (cf. Figures 1 and 2).
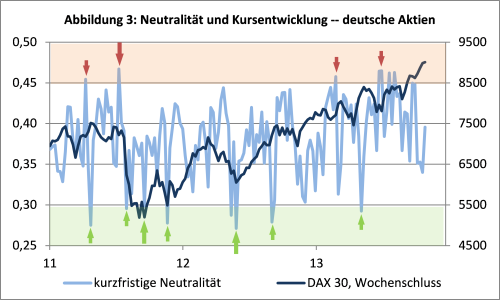
Extreme values in the Neutrality Index also say something about the price development in the market under consideration, since extreme values usually occur at market turning points (cf. Fig. 3). If, for example, there are only a few neutrals, this means that investors have largely understood the market and feel relatively secure. In most cases, this indicates trend fatigue or the end of a trend - because in such a situation there are hardly any investors left who will soon turn to the bull or bear camp and thus prices can hardly be driven further in a certain direction by additional players. In the opposite case, when many investors are neutral, the emergence of a new trend is also likely. In this case, it can be assumed that investors will subsequently form an opinion about the direction of the market (beyond a sideways movement), i.e. they will increasingly join the bull or bear camp again and their actions will also drive prices in the corresponding direction.
The short-term neutrality indices in particular can therefore be used as early indicators for trend reversals in volatility and price development, i.e. for timing the entry into or exit from a market. Optimally, this is done in combination with other sentix indices, especially in interaction with sentix Sentiment, sentix Strategic Bias and Investor Positioning. Because with the help of these indicators it is possible to make more valid statements about the future direction of a new trend. Neutrality indices, especially the short-term sentix Neutrality Indices, cannot do this on their own, because they are by definition directionless indicators. If the current trend in a market is identifiable, this circumstance is less of a problem: If, for example, an extreme value is shown in the short-term neutrality after a pronounced upward trend, this should usually indicate that a downward trend is imminent (Fig. 3). But firstly, it is sometimes possible that a sideways trend will follow. And secondly, clear downward or upward trends are not always discernible. If, for example, there is currently a sideways trend, the direction of the following trend cannot be determined using neutrality indices alone. Therefore, it is advisable to use sentix Sentiment, sentix Investor Positioning or the sentix Strategic Bias as contrasting indicators or directional indicators in order to clearly work out the direction of the coming trend (compare the corresponding compendium articles on the other sentix indicators).
The interpretation of the neutrality indices is basically similar for the 1-month and the 6-month period - sentix neutrality indices are available for both. Therefore, what has been described above applies to a greater extent when extreme values are reached at both time levels.
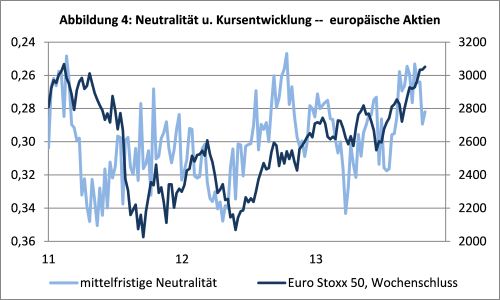
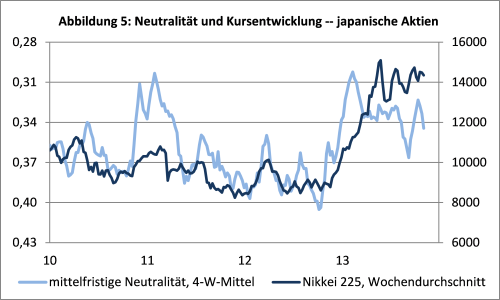
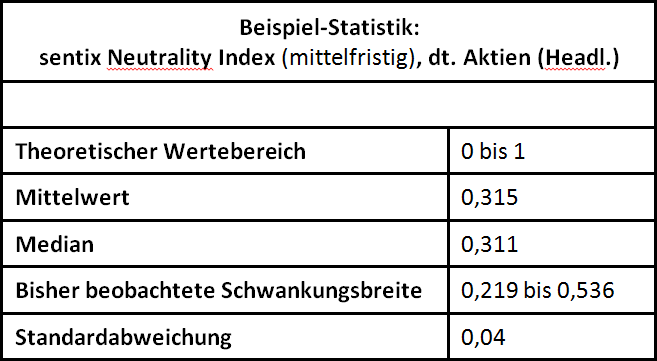
However, it can be seen that the neutrality index fluctuates less strongly at the 6-month level than at the 1-month level. It also shows that the medium-term neutrality index can be interpreted as a directional indicator for most markets. Examples of this property of 6-month neutrality are the corresponding indices for the European and Japanese stock markets (Figs. 4 and 5). If one inverts the neutrality indices here, they show a run-up ahead of the price development. This means that if the medium-term neutrality tends to fall, prices subsequently rise - and vice versa.
How can this be explained? Since stock markets tend to rise over the longer term, investors perceive phases of rising share prices as normal. In such phases, their security also increases or their uncertainty decreases. As a result, neutrality decreases. Conversely, uncertainty and neutrality increase when market weaknesses are imminent. And perhaps there is a bullish bias (inclination) among investors here, especially in stock markets, which prevents them from joining the bear camp and leads them to assign themselves to the neutral camp (despite pessimism). In this case, a larger number of neutrals (regardless of the number of bears) would already indicate falling share prices, a smaller number would indicate rising ones.
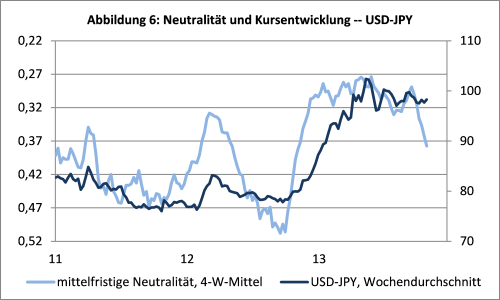
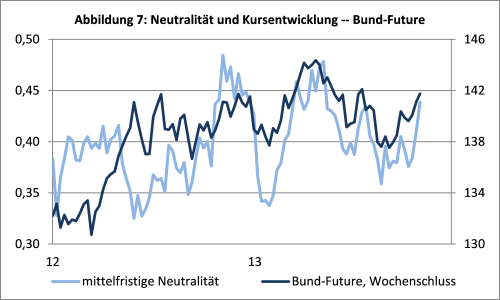
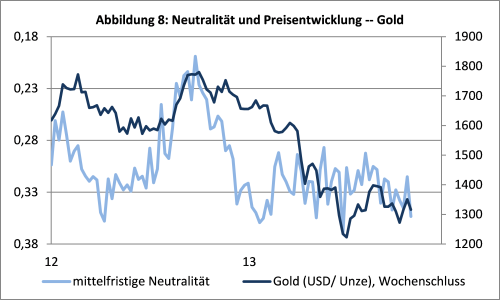
But medium-term neutrality can also be used as a leading directional indicator for other markets: In recent years, the correlation has been particularly clear for USD-JPY, Bund futures and the gold market. The direction of the correlation usually depends on the significance of uncertainty or irritation, which is reflected by neutrality, for the respective market. For example, rising neutrality on the USD-JPY market heralds a falling USD-JPY exchange rate, i.e. a stronger yen (Fig. 6). This is because rising uncertainty usually leads to a search for the Japanese currency. Higher neutrality for the Bund future is associated with a rising price for the Bund future, because the latter tends to be sought in times of higher uncertainty (Fig. 7). And finally, higher neutrality for the gold market means falling prices (Fig. 8). However, the argument here is the same as for equities: Because the gold market has been trending upwards since the early 2000s, an increase in neutrals should also already be understood here as an increase in pessimism that can be felt via the price.
Finally, it should be pointed out that the threshold values above which one can speak of extreme manifestations of the sentix Neutrality Index differ from financial market to financial market (see figures). For intermarket observations and comparisons, the neutrality indices should therefore be converted into Z-scores.



Customer Feedback (0)