“Overconfidence Index” signals danger for German stocks from the back

Print

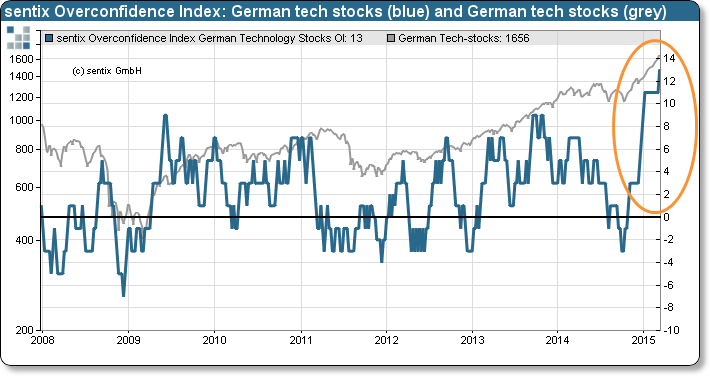
The sentix data display a rare peculiarity this week: the sentix Overconfidence Index for German technology stocks has climbed to a record high. It now signals an extreme trend perception among investors which may lead to complacency and overconfidence. In the past, such high readings were pointing to problems lying ahead.

The sentix Overconfidence Index for German technology stocks has risen by two to +13 points. By construction, it has now reached its maximum. Never before in its history (which goes back to 2001) the indicator had stood at this level. Its all-time high indicates that German tech stocks have – on a weekly basis – exclusively seen price rises over the past three months.

20150317 iif overconfidence eng

The high Overconfidence Index points to investors perceiving the price developments of German tech stocks as being in a strong uptrend. Such a perception usually promotes complacency and overconfidence. In this kind of situation a majority of investors can easily be caught on the wrong foot.

This is emphasised by a glance back into the history of the indicator: A reading of +13 could be observed only once since 2001 (when the time series for these indices start). It was the Overconfidence Index for US-technology stocks that hit this extreme at the end of March 2012. Following was a decline of the NASDAQ 100 index by 11.6% until the start of June 2012. This experience may serve as a warning for all those investors who are interested or are currently engaged in German tech stocks – the sentix Overconfidence Index points to an upcoming correction of German stocks in the back.

Background

The sentix Overconfidence Index (OCI) shows how probable it is at a given point in time that price behaviour in a market is perceived by investors as a trend. The higher this probability, the stronger the case for investors becoming overconfident regarding their forecasting skills. In a situation of overconfidence the probability, in turn, rises for a trend reversal as investors tend to accumulate excessive positions.

The OCI is calculated from the price movements of the corresponding financial market. It formally reflects how often prices have risen or fallen in the proximate past. The higher the index, the more often prices have increased recently on a weekly basis. The lower the index, the more often prices have fallen. Figuratively, one could speak of a coin toss for which the indicator records how many times head or tails comes up.

The OCI then illustrates the following: When one side of the coin comes up very often players would – after a while – doubt the fairness of the coin. They would believe that it is biased. And things are quite similar in financial markets: If a market shows, for instance, significantly more price increases than decreases, investors may think the market is biased and, thus, displays a trend – while a trend market is assumed to be much easier to forecast. Consequently, the subjectively felt confidence grows, and overconfidence arises among investors. This tends to lead to investors building up excessive positions.

The sentix Overconfidence Index can fluctuate between -13 and +13 points. Readings below -7 or above +7 indicate a high probability of investors being in a strong trend-perception phase and, thus, for a relatively high degree of complacency and overconfidence. The potential for a price movement against the trend then depends on the already accumulated investors’ positions.

The time series for the sentix Overconfidence Indices go back to June 2001.

We use cookies and third-party services that store information in the end device of a site visitor or retrieve it there. We then process the information further. This all helps us to provide you with our basic services (user account), to save the language selection, to optimally design our website and to continuously improve it. We need your consent for the storage, retrieval and processing. You can revoke your consent at any time by deleting the cookies from this website in your browser. Your consent is thereby revoked. You can find further information in our privacy policy. To find out more about the cookies we use and how to delete them, see our privacy policy.

I accept cookies from this site.

EU Cookie Directive Module Information