|
24 March 2014
Posted in
Special research
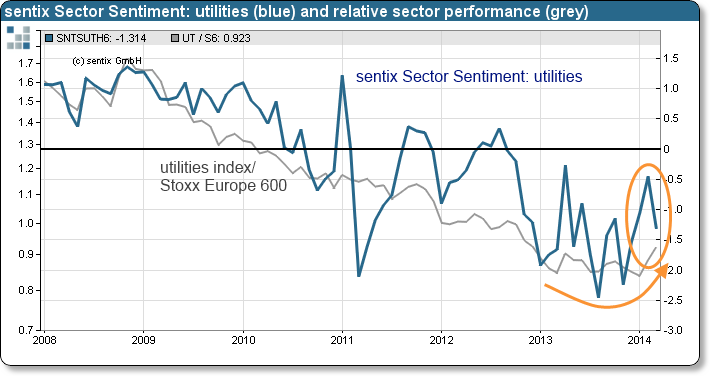
sentix Sector Sentiment for European utilities stocks experiences a significant setback in March. It is now the worst among all 19 Stoxx segments. The deterioration is rather remarkable as absolute and relative performances of utilities stocks have been rising over the past weeks. For contrarian investors this is a clear opportunity.
sentix Sector Sentiment for European utilities stocks falls by 0.86 to now -1.31 standard deviations (see "background" below for an explanation). It is now again the worst reading for all 19 Stoxx segments. This has last been the case in December 2013. But at the beginning of the year utilities sentiment had improved and, in February, even displayed an average value.
The current worsening comes a little bit as a surprise as absolute and relative performances of the European utilities index have been positive in the past weeks (see graph). Obviously, the negative news surrounding the big German utilities companies must have had a strong impact on investors' perceptions. Regarding these two major players there has been a lot of media attention concerning their latest cutbacks in profits and their outlooks which were corrected to the downsides.
Against the backdrop of the recent outperformance of utilities stocks, the renewed massive pessimism among investors looks like a denial. This constellation offers, once again, potential for the majority of investors to re-discover the sector. Usually this hints at good chances for (in the case of utilities stocks: continued) outperformance in the future.

Background:
The current sentix Sector Sentiment survey was conducted from March 20 to March 22, 2014. 945 individual and institutional investors took part in it.
sentix Sector sentiment is a monthly survey which is conducted since 2001 among individual and institutional investors via the internet. The survey is run around the third Friday of each month. Investors are asked about their six-month expectations regarding 19 European stock sectors. They can indicate whether they expect a sector to outperform, to perform as the market or to underperform. The survey results are normalised over all sectors and calculated as so-called z-scores. Z-Scores are standard deviations from the mean of a given sample. A value of +1 for a sector sentiment then means, for instance, that the expectations for the sector stand one standard deviation above the mean over all sectors.


