How to use the indicator
sentix Relative Sentiment is a group of indicators that correlates various sentix indices with each other in order to obtain additional information for asset allocation on the one hand and supplementary signals for market timing on the other. According to these two goals, the group is divided into two subgroups:
- ... into the group whose indices can be used for asset allocation. Here, the sentix Strategic Bias for two markets is correlated in each case
- ... into the group whose indices are suitable for market timing. Here, the expectations of private investors and those of institutional investors are compared with each other - at the sentix Sentiment level (1-month expectations) and at the Strategic Bias level (6-month expectations).
sentix Relative sentiment between asset classes
Indices are available in the indicator group as an instrument for asset allocation, which relate the strategic bias of two markets to each other. The respective index is constructed by forming the difference between the strategic bias of the two markets (at the same point in time). The indicator shows for which of the two markets investors have the higher preference at a given point in time and in which direction these investor preferences or expectations are developing. These relative expectations usually have predictive power for the relative price movements in the markets under consideration and can thus be used for asset allocation.
Figures 1 and 2 show two examples: Figure 1 shows the relative indicator for German government bonds compared to US bonds. The index signals major trend reversals early on and in a reliable manner, and thus also the persistence of longer-term trends. Especially when there are impulse-like changes in the perception of investors, this is usually a signal that a new, longer-lasting trend in the relative performance of the markets under consideration has been initiated. In Figure 1 this can be clearly seen in September 2012, when the relative index improves strongly in favour of German bonds. Such movements in the indicator also occur twice in 2013, followed by corresponding developments in relative performance. Figure 2 illustrates the predictive power of the relative indicator for Euroland equities in relation to Japanese stocks.
sentix Relative sentiment between investor groups
An instrument for timing in an individual market is obtained by contrasting the expectations of the investor groups of private and institutional investors, according to which the sentix data distinguish. Specifically, differences between the indices of private and institutional investors are also formed here. Thus, these relative indicators show the relative optimism of private investors: The higher such an indicator rises, the more optimistic the private investors are in relation to the institutional investors for the market under consideration. The lower the index falls, the stronger their relative pessimism.
The sentix Relative Sentiment indicator group contains a selection of difference indicators between private and institutional investors for both the short and medium term. Thus, relative indices from sentix Sentiment (1-month expectations) and from sentix Strategic Bias (6-month expectations) are offered.
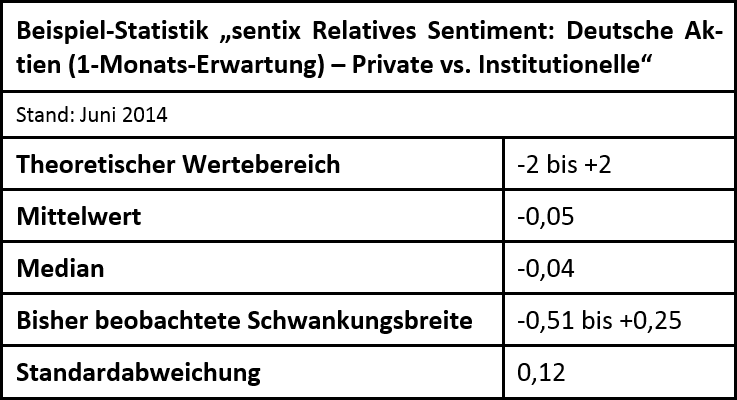
The absolute sentix Sentiment reflects the 1-month expectations of investors for a specific market. It is basically an indicator that is noticeably influenced by the current price development and fluctuates relatively strongly. If the indicator reaches extreme values in its fixed interval, this is in most cases the signal that a countermovement in the prices of the market under consideration is imminent. Relative sentiment also fluctuates strongly (cf. Figure 3). And here, too, upper peaks are a sign of an impending correction in the market in question. Lower extreme values indicate an imminent recovery. Consequently, the indicator can be used for market timing: When positive extremes are reached, the market should be "sold", when negative extremes are reached, the market should be "bought".
How can this be explained? At lower peaks of the indicator, for example, the relative pessimism of private investors is extreme. Beyond such a peak, the expectations of the two investor camps converge again. If one assumes that professional investors often change their expectations somewhat earlier than private investors, a regression of such an extreme value of the relative indicator could be a sign that private investors (after a phase of divergent expectation development) are again adapting to the "opinion leaders" of the institutional investors and that then a change in sentiment is taking place among the majority of investors - namely among both investor groups (first among the institutional, then also among the private). This would make it highly likely that the turned expectations would also trigger corresponding price reactions.
An analogous argument applies to the relative indicator, which is formed for the strategic bias from the time series of the private and institutional investors. However, the strategic bias, which reflects the basic convictions of investors, fluctuates much less than sentix sentiment. Accordingly, the relative indicator, which is again constructed as a difference index, is somewhat smoother than its counterpart for sentix sentiment. But Figure 4 (on the EUR-USD currency pair) shows that the following also applies here: extreme values in the relative indicator indicate reversal points in the relative price development. The more impulsive the initial movement of the indicator, the more pronounced the price developments are. Moreover, this index points more strongly than the one constructed from sentiment to the existence of longer-term trends.
")
")
 und relative Performance deutscher und US-amerikanischer Anleihen")
 und relative Performance der Aktien Eurolands und Japans")
 und DAX 30")
 und EUR-USD-Kurs")


Customer Feedback (0)